TIERA Book demo ->
Made in India · Sound & vibration

Learn it. Sound & vibration, end to end.

Vibration instruments, condition-monitoring software, and ISO-aligned CAT I/II training — engineered and built in India, trusted by ISRO, DRDO and Rolls-Royce.

Trusted by
  • VSSC / ISRO
  • DRDO
  • NIT Trichy
  • Rolls-Royce, Bangalore
  • Schaeffler
  • Augury
  • USENS
  • SSPL
TIERA ecosystem map

Product families that become complete measurement workflows.

Sensors, mounts, cables, DAQ, software, simulators, calibration and training work together. The value is in the combined signal chain, not in one product sitting alone on a shelf.

How to read this section

Each workflow below shows what gets measured, which TIERA products are used, which analysis method is applied, and what engineering decision it supports.

Technical multi-product workflows

See how TIERA products combine during real diagnostic work.

These are not marketing categories. They are practical routes for acquiring signals, validating machines, creating fault data, training analysts and producing reports.

Open use-case library
Condition monitoring route
Workflow 01

Condition monitoring route

A repeatable plant-health workflow for rotating assets, with reportable spectra and trend evidence.

PhonoVibeT-VibAccelerometersLow-noise BNC cables
Signals / analysis
Time waveformFFT spectrumRMS / crest factorAlarm bands
Engineering insight

Detect imbalance, misalignment, looseness, bearing wear, cavitation and electrical symptoms before the machine reaches a shutdown condition.

Measurement method

Mount IEPE accelerometers on motor, pump, fan or gearbox points, route signals through low-noise BNC cables, acquire with PhonoVibe, then analyse time waveform, RMS, crest factor, FFT and alarm bands in T-Vib.

Calibration and QA
Workflow 02

Calibration and QA

Audit-ready sensor QA for internal labs, service teams and customer-facing test reports.

T-CalibroAccelerometersCalibration software
Signals / analysis
Reference vibrationSensor sensitivityCalibration recordQA status
Engineering insight

Protect the whole measurement chain by checking the sensor before trusting a spectrum, trend or acceptance report.

Measurement method

Verify accelerometer sensitivity on T-Calibro before field tests, record the calibration result, then use the verified sensor with PhonoVibe and T-Vib for audited measurement jobs.

Modal and shaker testing
Workflow 03

Modal and shaker testing

A lab workflow for modal, shaker and resonance studies with traceable input-output measurements.

PhonoVibe Eco XShaker standImpact hammerT-Vib FRF
Signals / analysis
FRFCoherencePhaseNatural frequency
Engineering insight

Separate structural resonance from machine faults and support product design, fixture validation and NVH troubleshooting.

Measurement method

Excite the structure using an impact hammer or electrodynamic shaker on a vertical or horizontal stand. Acquire reference and response channels in PhonoVibe, then use T-Vib FRF, coherence and cursor bands to study resonances.

Acoustic material testing
Workflow 04

Acoustic material testing

A controlled sound-material testing workflow for R&D, acoustic labs and enclosure development.

T-SonusMicrophonesPhonoVibeT-Vib
Signals / analysis
Absorption coefficientAcoustic impedanceTransfer functionFrequency response
Engineering insight

Move from subjective noise judgement to material-level acoustic evidence that design teams can compare and document.

Measurement method

Use the T-Sonus impedance tube with microphones, signal generation and acquisition to compare foams, liners, panels, ducts and enclosure materials under controlled acoustic excitation.

Fault dataset generation
Workflow 05

Fault dataset generation

A controlled data pipeline for AI developers, reliability classrooms and vibration analyst training.

TMFSSPhonoVibe HDT-VibToLearnVibe
Signals / analysis
Labelled fault runsRPM sweepOrder contentTraining spectra
Engineering insight

Build reliable examples because the machine fault is known, repeatable and safer than waiting for random plant failures.

Measurement method

Use TMFSS to create controlled faults such as unbalance, misalignment, bearing defects, gear faults, belt faults and pump cavitation. Capture each run with PhonoVibe HD, label it in T-Vib, then convert examples into ToLearnVibe lessons or AI datasets.

Vibration analyst training
Workflow 06

Vibration analyst training

A practical curriculum that connects ISO-style theory, simulation and hands-on machinery behaviour.

ToLearnVibeTMFSSTraining kitsPhonoVibe
Signals / analysis
Simulated spectraReal fault spectraPhase / RPM cluesAnalyst report
Engineering insight

Students see how textbook symptoms change when sensor mounting, speed, loading and measurement settings become real.

Measurement method

Begin with ToLearnVibe simulations, then reproduce the same symptoms on TMFSS using training kits, acquire real sensor data through PhonoVibe, and review the signature in T-Vib.

TIERA 101 · Free · badges

One signal, three tracks, three badges.

Free, self-paced primers. Pass a course exam (25 questions, 90% to pass, 2 attempts) for a certificate; clear a whole track and an optional badge exam (50 questions, 90% to pass, 2 attempts, 60 minutes) earns a verifiable digital badge, issued and checkable at certify.tieraonline.in. All 10 courses across three tracks are live now — roughly 11–18½ h of study in total. Earn any 2 badges for TIERA 101 Merit, all 3 for TIERA 101 Graduate.

An open climb: you move to the next track by passing the previous track's course exams, and the badge exam is optional — how you claim the title, not how you progress. These free primers introduce some ISO 18436-2 Category I–III topics — partial coverage in every case. Not an accredited ISO certification.

Explore TIERA 101 ->
New service for industry

AI marketing systems for technical companies.

TIERA now helps industrial and engineering teams convert product knowledge into sales-ready websites, CRM workflows, datasheets, manuals, videos, product visuals, email campaigns, and Telegram-connected follow-up systems.

Because TIERA is already a technical company, the AI workflows can be shaped around specifications, applications, instrumentation details, maintenance questions, and how real industrial buyers evaluate products.

AI-powered technical marketing workflow for industrial product teams
AI CRM and sales workflows
AI Inventory-linked product catalogs
AI Websites, landing pages, and chatbots
AI Datasheets, manuals, white papers, and technical notes
AI User videos, product visuals, and AI-generated images
AI Email marketing, Telegram integration, and campaign analytics
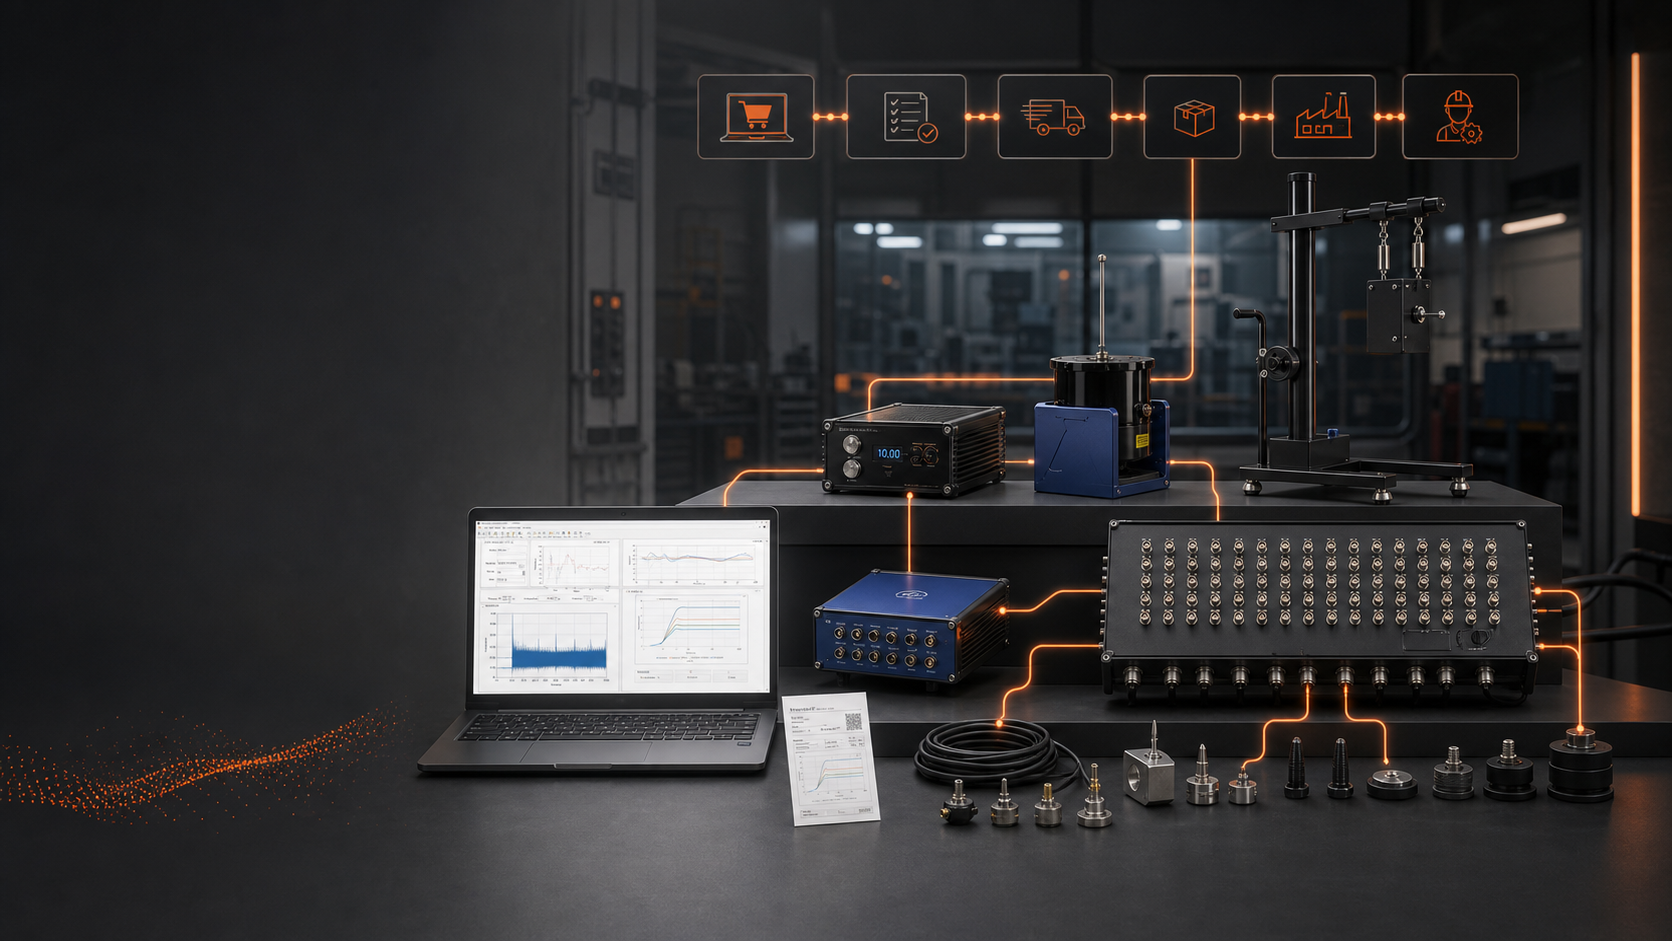
How a TIERA system works

Build the full test path, from sensor to report.

Product selection, store purchase, calibration and custom test accessories now live in one clearer workflow.

SensorsDAQCalibrationFixturesSoftwareReports
TIERA industrial workflow stack from store to test site
Industrial workflow stack
StoreCalibrateMeasureReport
01

Capture

PhonoVibe DAQ samples up to 128 kHz at 24-bit through IEPE sensors with TEDS — plug-and-play over USB on Windows 10/11.

02

Analyse

TVIB TSAP 201 runs spectrum, FRF, octave measurements, order tracking and modal — the standard diagnostic toolbox vibration analysts already use.

03

Decide

Export trends, share reports, and act before failure. Optional TCAT training — aligned with ISO 18436-2 — turns your team into qualified analysts.

Featured product
T-Calibro

PC-based vibration calibrator with report-ready software.

T-Calibro calibrates and verifies accelerometers, vibration meters and online protection-system sensor chains using stable, traceable vibration signals.

The workflow combines shaker hardware, reference sensor, Windows software, sensor database management and T-Calibro test reports for documented calibration work.

Frequency tests
Step, sine-sweep and random tests
Deviation records
Sensitivity, phase and linearity
Asset history
Sensor database and calibration log
Word export
Customer-ready documentation
T-Calibro vibration calibrator with PC software and shaker
Technical snapshot
Frequency range
10 Hz - 10 kHz
Amplitude range
0.1 g - 10 g RMS
Max load capacity
500 g
Reference sensor
Built-in, traceable/NABL
Accuracy
+/-3.5%
Interface
Windows PC software + USB
T-Calibro software
Setup, run calibration and maintain sensor records.
Click any screen to zoom
New product launches

New hardware for larger vibration test workflows.

TIERA is expanding the test chain with channel-dense junction boxes, shaker stands and IEPE power accessories for labs working with more sensors, heavier fixtures and directional excitation.

Ask for launch details
64-channel BNC vibration junction box
High-density signal routing

64-channel BNC junction box

A 64-channel BNC junction box for vibration measurement, acoustic testing, modal analysis and structural health monitoring.

Datasheet: 4 zones x 16 channels, lockable powder-coated chassis, cable glands, castor-supported stand and delivery test report for THD, noise floor and 10 Hz-20 kHz frequency response.

64 BNC channels4 x 16 zonesTest report
Vertical shaker stand for structural vibration testing
Aircraft structure testing

Vertical shaker stand

A vertical stand for holding a shaker during vibration testing of aircraft structures, panels and other test structures.

Designed around height adjustment, mobility, locking castors and levelling feet so the shaker remains supported and aligned during vertical excitation.

Vertical excitationLevelling feetCastors
TIERA LES-2000 lateral excitation stand
Horizontal and oblique excitation

TIERA Lateral Excitation Stand

Model LES-2000 adapts electromagnetic shakers for horizontal and oblique input excitation during modal and structural testing.

Datasheet: 200 cm vertical adjustment, 30 cm horizontal adjustment, up to 50 kg shaker support, tensioned wire stinger and decoupled shaker dynamics.

LES-200050 kg shakerWire stinger
4-channel IEPE power source
Sensor power accessory

4-channel IEPE power source

A 4-channel IEPE/ICP power source for accelerometer powering in compact multi-sensor measurement chains.

Front-panel channel selector, bias-voltage display and DC 24 V powered operation for lab, field and DAQ companion workflows.

4 channelsIEPE / ICPBias voltage
Technology blog

Field notes for vibration, AI and test labs.

Practical articles for research teams, wireless sensor companies and reliability engineers building modern measurement workflows.

View all articles ->
TIERA 101 Training Condition monitoring
TIERA 101 / 8 min read

TIERA 101: Why a Free Vibration Programme Is Worth Your Time

Ten free courses, 359 lessons, 211 simulators you actually drive — built by the people who build the instruments. What TIERA 101 is, what it honestly is not, and why both plants and universities are using it.

Hard concepts · Order analysis

When the Speed Will Not Sit Still: Smeared Spectra and Order Tracking

On a VFD-driven machine a perfectly good analyser can produce a useless spectrum: shaft speed drifts during the average, every shaft-related peak walks across bins, and the 10th order smears ten times as badly as the 1st. Order tracking — resampling the signal against shaft angle using a tacho pulse — collapses the smear back into sharp lines. A hard-concepts walk through why, with a live rig: dial in speed wobble, pile on averages, and watch the Hz spectrum die while the order spectrum holds.

9 min read
Modal testing — hard concepts

Coherence: the Number That Tells You Your FRF Is Lying

Every FRF comes with a built-in lie detector, and most people never look at it. What coherence actually measures, why it dips at antiresonances but must not dip at your peaks, how H1 and H2 fail in opposite places, and why a single average always reads a perfect — and perfectly meaningless — 1.0.

10 min read
Interactive explainer

Build the Spectrum Yourself: What Unbalance, Misalignment and Looseness Actually Look Like

An interactive mini-explainer: assemble a machine's vibration from its parts — 1x, 2x, a harmonic comb — and watch the time waveform and spectrum change live. Learn the three classic signatures by driving them.

9 min read
Bearing diagnostics

Work Out What Your Bearing Will Sound Like Before It Fails

Four numbers — Z, d, D and the contact angle — fix the exact rhythm every bearing surface will drum out when it spalls. Derive BPFO, BPFI, BSF and FTF from the standard formulae, see why none of them is a whole number, and dial in your own geometry on the live calculator.

7 min read
Interactive · Bearing diagnostics

Tune the Band, Find the Bearing: An Interactive Envelope Demodulation Simulator

Envelope analysis is a tuning job: park a band-pass window on the bearing's ring frequency and the defect comb appears; slide it off and the comb dies. This simulator computes the whole chain live — synthesised impacts, a real band-pass filter, a real envelope spectrum — so you can feel it, like tuning a radio.

7 min + hands-on
Interactive

Solve a Single-Plane Balance Yourself: A Live Influence-Coefficient Solver

Enter a reference run, a trial weight and a trial run, then drag the weight around the rotor and watch the correction mass and angle update live. The arithmetic behind every field balance, running in your browser.

6 min + play
Interactive lab

Run It Up Yourself: Drive a Machine Through Resonance on a Live Campbell Diagram

A hands-on companion to our resonance-or-forcing explainer. Drag the running speed, set one or two natural frequencies and a damping level, and watch forcing lines cross structure lines on a Campbell diagram while an honestly-computed response curve shows the shudder build and fall away.

7 min read
Interactive lab

Catch an Alias in the Act: A Live Sampling Playground

Our aliasing explainer told you why undersampled signals lie. This one lets you make them lie: two sliders, a live plot of the true signal, the stored samples and the false reconstruction, and a readout that computes the fold as you cross Nyquist.

5 min + playground
FFT fundamentals

Why Your Peak Is the Wrong Height: Windows, Leakage and the Honest Amplitude

The FFT quietly assumes your record repeats forever — and when a tone doesn't fit the record, its peak drops and smears. A visual walk through leakage, scalloping and coherent gain, with a live comparator: pick a window, slide the tone off a bin, and watch the measured amplitude lie or hold.

7 min read
Phase analysis

Phase: The Ruler Most People Never Pick Up

Amplitude says how much, frequency says how often — phase says how the machine is actually moving. A mini explainer plus a live simulator: pick a fault, toggle the measurement direction, and read the phase pattern that separates faults the spectrum cannot.

8 min read
Gearbox diagnostics

One Chipped Tooth, Once per Revolution: Reading Gear Mesh and Its Sidebands

The mesh tone is a gearbox's normal singing voice — its height alone proves little. A chipped tooth modulates that tone once per revolution, growing sidebands around the GMF, and their spacing names the guilty shaft. Includes a live spectrum explorer you can drive.

8 min read
Mounting bandwidth

The Magnet That Deleted a Bearing Fault

How you attach the sensor decides which frequencies you are allowed to see. A mini explainer plus a live simulator: pick stud, adhesive, magnet or probe, drag a fault frequency, and watch an early bearing tone vanish.

7 min read
Vibration severity

How Bad Is 4.5 mm/s? Reading Vibration Severity Without Guessing

4.5 mm/s RMS is a red flag on a small motor and mid-band normal on a large turbine set. An interactive checker shows how ISO 20816-style severity zones shift with machine class and mounting — and why your own trend beats any table.

7 min read
Alarm strategy

Set the Alarm Too Tight and Nobody Listens: Choosing Thresholds You Can Live With

Every alert and alarm line is a bet between wasted trips and lost warning time — there is no perfect threshold, only one your team can live with. A mini explainer plus a live trainer: drag the lines, count the false alarms, watch the warning window shrink, and see what a simple consecutive-readings rule buys.

8 min read
Bearing diagnostics

Why a Failing Bearing Hides in the Noise — and How Envelope Demodulation Finds It

An early bearing defect is a tiny, perfectly repetitive impact buried under shaft and blade energy. Enveloping — band-pass around the resonance, then demodulate — makes its comb visible long before the machine gets loud.

6 min read
Field diagnostics

Is It Resonance, or Is It the Force? How to Tell in an Afternoon

Why balancing a machine again and again never fixes a resonance, what a natural frequency actually is, and the two quick field tests — the bump test and the coast-down — that settle the question.

6 min read
Field balancing

Balancing a Rotor in Place: Trial Weights, Phase and the Influence-Coefficient Method

A visual walk through field balancing — reference run, trial run, correction, verification — why every run must be at the same speed, and what an ISO 21940 balance grade really commits you to.

7 min read
DAQ fundamentals

Sample Rate, Fmax and the Anti-Alias Filter: Getting the Front End Right

An alias is indistinguishable from a real fault once it is in the file. A visual walk through sampling, folding, Fmax, lines and the anti-alias filter — and how to pick a DAQ channel that cannot lie to you.

6 min read
Fault simulation

Building a Controlled Machinery Fault Library with TMFSS

A visual mini-explainer: how a lab reproduces unbalance, misalignment, looseness, bearing defects and gear faults on demand, and why a label you set before capture beats a label you guess afterwards.

7 min read
Modal testing

Mode Shapes, Explained with a Skipping Rope

What a mode shape is, why one structure has several, when to reach for a hammer versus a shaker, and how to read an FRF — the short visual version for R&D teams chasing a ringing panel or bracket.

6 min read
End-of-line QA

Pass or Fail in Seconds: How End-of-Line Noise and Vibration Testing Works

How a production line turns a skilled inspector's ear into a repeatable, auditable spectral limit test: why one overall number is too blunt, how band masks judge each unit, and why the limit itself is an economic decision.

6 min read
Measurement trust

What Makes a Vibration Reading Trustworthy

4.2 mm/s is not a fact — it is a voltage divided by an assumed sensitivity. A short visual tour of sensitivity, drift, damage, and what back-to-back calibration against a reference actually proves.

6 min read
Honest AI

What AI Can and Cannot Tell You About a Machine

Anomaly detection is genuinely useful: it says 'this is not normal' earlier than a human round can. But it does not name the fault, and it inherits every bias in the baseline it learned. An honest look at scores, thresholds, false alarms, and why labelled data matters.

6 min read
Condition monitoring

Starting a Condition-Monitoring Programme Without Buying Everything at Once

The practical first 90 days: pick the machines that actually matter, define a repeatable route, take a baseline while they are healthy — and only then argue about alarm limits.

7 min read
AI datasets

ML / AI Algorithm Development for Predictive Maintenance

How controlled machinery faults, synchronized vibration capture, and analyst-labelled features create useful training data for predictive-maintenance models.

8 min read
Sensor validation

Wireless Sensor Validation Lab

A reference workflow for validating wireless accelerometers against wired sensors, calibration systems, and repeatable machinery faults.

7 min read
University labs

Machine Condition Monitoring Lab for Research Universities

How universities can build a practical vibration lab for condition monitoring, diagnostics, modal testing, and student research.

9 min read
Acoustic materials

Acoustic Impedance and Transmission Loss Measurement of Materials

How impedance tube testing helps labs measure absorption coefficient, acoustic impedance and transmission loss for foams, liners, panels and enclosure materials.

8 min read
View all articles -> 32 posts and counting